Always Measure One Level Deeper
Always Measure One Level Deeper
Thoughts about Always Measure One Level Deeper by John Ousterhout.
Before we dive into this, this was written in 2018 when John was not retired yet (I think)
Thoughts along the way
Performance measurement is one of the most important parts of software development. In academic research a thorough performance evaluation is considered essential for many publications to prove the value of a new idea. In industry, performance evaluation is necessary to maintain a high level of performance across the lifetime of a product.
To the point and not immediately obvious
As a result, performance measurement is often done poorly, even by experienced developers. For example, if you have written a conference paper on a software system, it probably unfolded like this: The system implementation took longer than expected, so performance evaluation could not begin until a week or two before the paper submission deadline. The first attempts to run benchmarks resulted in system crashes, so you spent the next week fixing bugs. At this point the benchmarks ran, but the system’s performance was not much better than the comparison systems. You tried different experiments, hoping to find one where the system looked good; this exposed yet more bugs that had to be fixed. Time was running out, so you stopped measuring as soon as you found an experiment that produced positive results. The paper focused on this experiment, omitting the results that were less favorable.
Every single paper is like this
Mistake 1: Trusting the numbers. Engineers are easily fooled during performance measurements because measurement bugs are not obvious. Engineers are used to dealing with functional bugs, which tend to be noticeable because they cause the system to crash or misbehave. If the system produces the desired behavior, it is probably working. Engineers tend to apply the same philosophy to performance measurements; if performance numbers are being generated and the system is not crashing, they assume the numbers are correct.
Wow, good insight
I designed our first log-structured file system,4 we were fairly certain that reference patterns exhibiting locality would result in better performance than those without locality. Fortunately, we decided to measure, to be sure. To our surprise, the workloads with locality behaved worse than those without. It took considerable analysis to understand this behavior. The reasons were subtle, but they exposed important properties of the system and led us to a new policy for garbage collection that improved the system’s performance significantly. If we had trusted our initial guess, we would have missed an important opportunity for performance improvement.
Can’t make assumptions!
It is unsafe to base conclusions on intuition alone, yet engineers do it all the time. A common mistake is for an engineer to hypothesize that a particular data structure is too slow and then replace it with a new data structure the engineer believes will be faster. If the problem is not verified by measuring performance, there is a good chance the optimization will not improve performance. The code change will simply waste a lot of time and probably introduce unnecessary complexity.
I do this all the time – need to measure with and without
When I find a guess presented as fact and ask for justification, I sometimes get this response: “What else could it possibly be?” But this is a cop-out, suggesting it is up to others to prove the theory wrong and OK to make unsubstantiated claims until someone else proves them false.
Same with this
Most performance measurements I see are superficial, measuring only the outermost visible behavior of a system (such as the overall running time of an application or the average latency of requests made to a server). These measurements are essential, as they represent the bottom line by which a system is likely to be judged, but they are not sufficient. They leave many questions unanswered (such as “What are the limits that keep the system from performing better?” and “Which of the improvements had the greatest impact on performance?”). In order to get a deep understanding of system performance, the internal behavior of a system must be measured, in addition to its top-level performance.
Wow, yes this takes time
Confirmation bias causes people to select and interpret data in a way that supports their hypotheses. For example, confirmation bias affects your level of trust. When you see a result that supports your hypothesis, you are more likely to accept the result without question.
Confirmation bias also affects how you present information. You are more likely to include results that support your hypothesis and downplay or omit results that are negative. For example, I frequently see claims in papers of the form: “XXX is up to 3.5x faster than YYY.” Such claims cherry-pick the best result to report and are misleading because they do not indicate what performance can be expected in the common case. Statements like this belong in late-night TV commercials, not scientific papers.
Bias, need to present well
Performance analysis is not an instantaneous process like taking a picture of a finished artwork. It is a long and drawn-out process of confusion, discovery, and improvement. Performance analysis goes through several phases, each of which can take anywhere from a few days to a few weeks. First, you must add instrumentation code to the system to record the desired metrics. You must then get benchmark applications running, either by writing them or by downloading and installing existing programs. Running benchmarks will probably stress the system enough to expose bugs, and you will need to then track down and fix them. Eventually, the system will run well enough to start producing performance numbers. However, these numbers will almost certainly be wrong. The next step is to find and fix bugs in the measurements. Once you have verified the accuracy of the measurements, you will start to uncover problems with the system itself. As you look over the performance measurements, you will probably uncover additional functional bugs. Once they have been fixed, you can start analyzing the performance in depth. You will almost certainly discover opportunities to improve performance, and it is important to have enough time to make these improvements. You will encounter many things that do not make sense; in order to resolve them, you will need to add new metrics and validate them. To get the best results, you must iterate several times improving the metrics, measuring performance, and improving the system.
What an example. Iterate iterate iterate
I often challenge them by asking: “Suppose I said I don’t believe these measurements. What can you say to convince me that they are correct?”
Ask myself this
As you begin collecting measurements, compare them and be alert for inconsistencies. There will almost always be things that do not make sense. When something does not make complete sense, stop and gather more data. For example, in a recent measurement of a new network transport protocol, a benchmark indicated that a server could handle no more than 600,000 packets per second. However, my colleagues and I had seen servers process more than 900,000 packets per second with other protocols and believed the new protocol was at least as efficient as the old ones. We decided to gather additional data. As a result, we discovered a bug in the flow-control mechanism on the client side: clients were not transmitting data fast enough to keep the server fully loaded. Fixing the bug improved performance to the level we expected.
Interesting, gather, but how to know what to do next and what data to filter? I guess that’s based on experience
Keys to High-Quality Performance Analysis
The first step toward high-quality performance measurements is to allow enough time. If you are measuring a non-trivial system, you should plan on at least two to three months.
That’s interesting – this makes senses, but this takes a loooong time
Performance analysis is not an instantaneous process like taking a picture of a finished artwork. It is a long and drawn-out process of confusion, discovery, and improvement. Performance analysis goes through several phases, each of which can take anywhere from a few days to a few weeks.
Take different measurements at the same level. For example, if you are measuring file-system throughput, do not measure just the throughput seen by a user application; also measure the throughput observed inside the operating system (such as at the file block cache). These measurements should match;
Measure the system’s behavior at a lower level to break down the factors that determine performance, as I discuss later under Rule 4 (Always measure one level deeper);
Make back-of-the-envelope calculations to see if the measurements are in the ballpark expected; and
Run simulations and compare their results to measurements of the real implementation.
Damn this is different steps. Always double check essentially
Above all, do not tolerate anything you do not understand.
What a thought.
Above all, do not tolerate anything you do not understand. Assume there are bugs and problems with every measurement, and your job is to find and fix them. If you do not find problems, you should feel uneasy, because there are probably bugs you missed.
The best way to use intuition is to identify promising areas for further exploration. For example, when looking over performance measurements, ask yourself if they make sense. How does the performance compare to what you expected? Does it seem too good to be true? Does the system scale more poorly than you had hoped? Does a curve jump unexpectedly when you expected it to be smooth? Do some benchmarks exhibit behavior that is dramatically different from others? Consider anything that does not match your intuition a red flag and investigate it, as described in Rule 2 (Never trust a number generated by a computer). Intuition can be very helpful in identifying problems.
If you continually form intuitions and then test them you will gain knowledge that helps you form better intuition in the future. Every false intuition means there was something you did not fully understand; in the process of testing it and discovering why it is false, you will learn something useful.
Intuition is used as a guide for the first step
If you are measuring overall latency for remote procedure calls, you could measure deeper by breaking down that latency, determining how much time is spent in the client machine, how much time is spent in the network, and how much time is spent on the server. You could also measure where time is spent on the client and server. If you are measuring the overall throughput of a system, the system probably consists of a pipeline containing several components. Measure the utilization of each component (the fraction of time that component is busy). At least one component should be 100% utilized; if not, it should be possible to achieve a higher throughput.
Latency and throughput measurements in a single sentence?
In recent measurements of a new network transport, one of my students found that round-trip tail latency was higher than our simulations had predicted. The student measured software latency in detail on both the sending and the receiving machines but found nothing that could account for the high tail latency. At this point we were about to conclude that the delays must be caused by the network switch. What else could it be? This would have been Mistake 2 (Guessing instead of measuring). Before giving up, we decided to dig deeper and measure precise timings for each individual packet. The measurements surprised us, showing that outlier delays were not isolated events. Delay tended to build up over a series of packets, affecting all of the packets from a single sender over a relatively long time interval, including packets for different destinations. This was a crucial clue. After several additional measurements, the student discovered that long queues were building up in the sender’s network interface due to a software bug. The transport included code to estimate the queue length and prevent queue buildup, but there was a bug in the estimator caused by underflow of an unsigned integer. The underflow was easy to fix, at which point tail latency dropped dramatically. Not only did this process improve the system’s performance, it taught us an important lesson about the risks of unsigned integers.
Good example
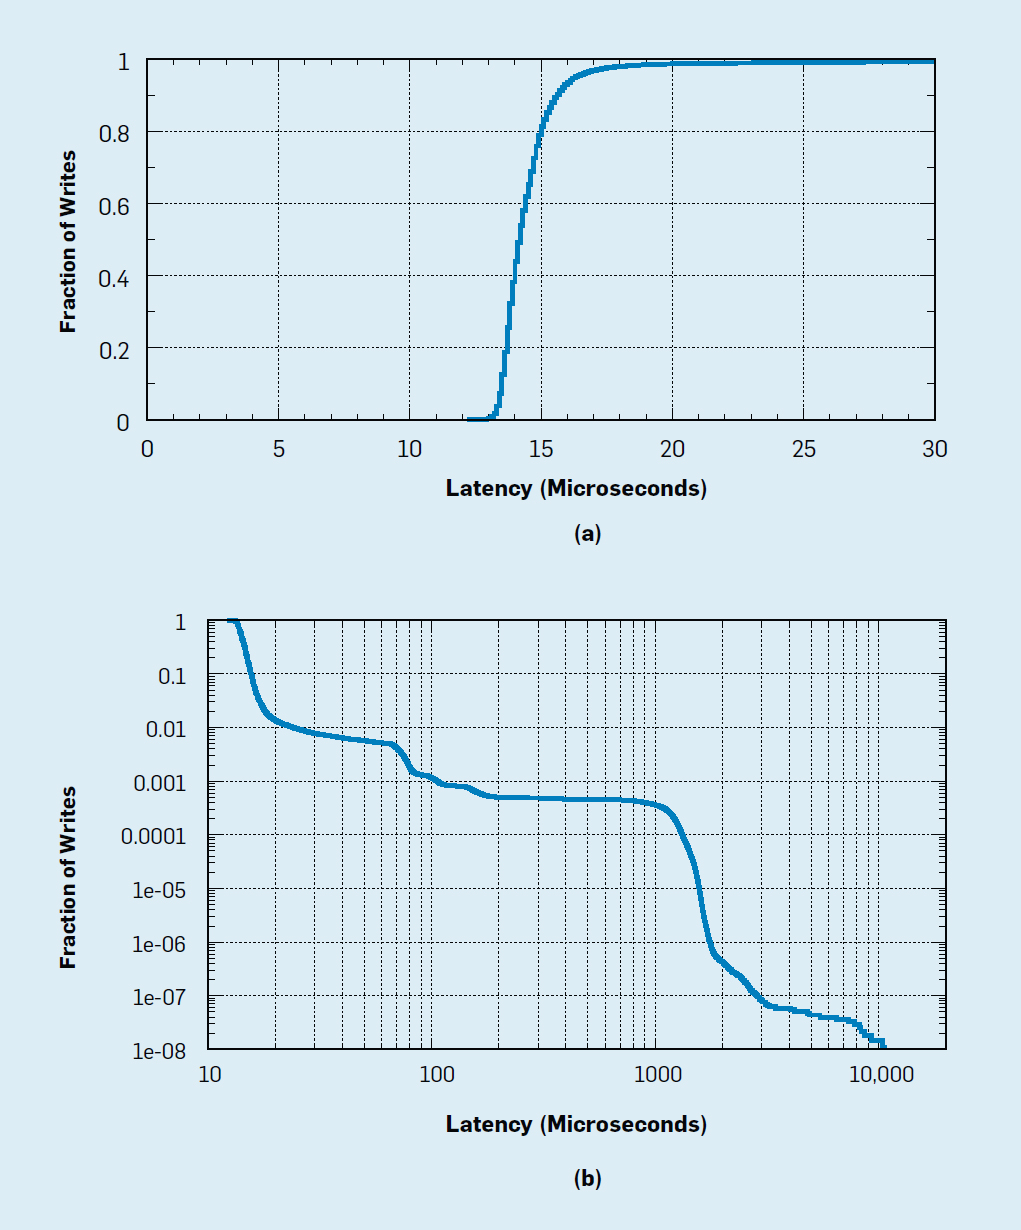
Another way to measure deeper is to consider more detail. Instead of just looking at average values, graph the entire distribution and noodle over the shape to see if it provides useful information. Then look at some of the raw data samples to see if there are patterns. In one measurement of RPC latency, a student found that the average latency was higher than we expected. The latency was not intolerably high, and it would have been easy to simply accept this level of performance. Fortunately, the student decided to graph the times for individual RPCs. It turned out the data was bimodal, whereby every other RPC completed quickly, but the intervening ones were all significantly slower. With this information, the student tracked down and fixed a configuration error that eliminated all of the slow times. In this case, the average value was not a good indicator of system behavior.
So basically always look at indivudal ones and keep measuring
Do not spend a lot of time agonizing over which deeper measurements to make. If the top-level measurements contain contradictions or things that are surprising, start with measurements that could help resolve them. Or pick measurements that will identify performance bottlenecks. If nothing else, choose a few metrics that are most obvious and easiest to collect, even if you are not sure they will be particularly illuminating. Once you look at the results, you will almost certainly find things that do not make sense; from this point on, track down and resolve everything that does not make perfect sense. Along the way you will discover other surprises; track them down as well. Over time, you will develop intuition about what kinds of deeper measurements are most likely to be fruitful.
I see, just go for it, use standard tools
Measurement Infrastructure
Making good performance measurements takes time, so it is worth creating infrastructure to help you work more efficiently. The infrastructure will easily pay for itself by the time the measurement project is finished. Furthermore, performance measurements tend to be run repeatedly, making infrastructure even more valuable. In a cloud service provider, for example, measurements must be made continuously in order to maintain contractual service levels. In a research project, the full suite of performance measurements will be run several times (such as before submission, after the paper is accepted, and again during the writing of a Ph.D. dissertation). It is important to have infrastructure that makes it easy to rerun tests.
Yes I see… this is how you learn how to build such infrastructure
Summary/Important takeaways
- Dig deep into understanding performance
- The question is how to do so (are you measuring the right thing and how to identify when you fucked up)
- This is a trained methodlogy (way of thinking to measure performance), which is not easy to be disciplined
- Mistakes to watch out for
- Trusting numbers immediately if the system is not crashing
- performance bugs occur in non crashing conditions, thus are not immediately obvious
- so the logical question is how do you prove that the numbers are trust-worthy?
- Guessing (or making what seems obvious assumptions) without backing up the claims
- ex, system is bottlenecked by I/O, well you need to show that it’s true with numbers, and maybe actually it isn’t bottlenecked by I/O, this is very true
- Only measuring end-2-end
- What would make it better? What’s taking the longest in the system?
- If you believe in the idea, you believe that the performnace will be good (confirmation bias) and not double checking that number
- Don’t rush your numbers that you measure - easy to make mistakes
- Trusting numbers immediately if the system is not crashing
- How to not make mistakes
- Time
- Need to build instrumentation, benchmarks, patch bugs, repeat
- Find different ways to measure the same thing/Don’t trust the number
- “I often challenge them by asking: “Suppose I said I don’t believe these measurements. What can you say to convince me that they are correct?””
- For example, if you are measuring file-system throughput, do not measure just the throughput seen by a user application; also measure the throughput observed inside the operating system (such as at the file block cache). These measurements should match
- Use your intuition to ask questions, not to answer them
- It’s good to have a gut feeling to check something, but always verify that it’s true
- Always measure one level deeper to breakdown numbers
- ex, e2e measure latency, can breakdown client, server, network time
- validate top level numbers
- use your knowledge of known tools
- Time
- Measurement Infrastructure
- How to build your set of tools to measure performance
- What is good infrastructure
- Automated, each run does the performance
- Easy to digest/understand
- benchmarks to compare
- Dashboard
- goal: easy to understand!
- but brings together a lot of data
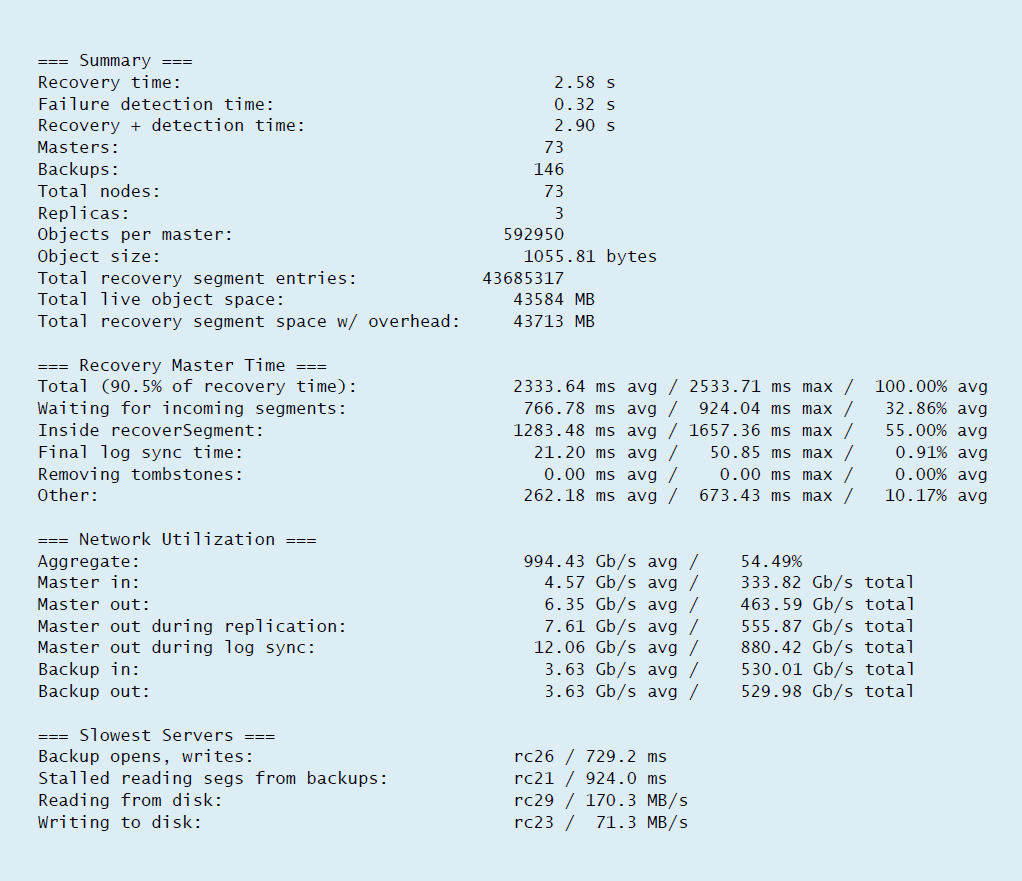
- Gives a lot of information and breaking each one down with e2e, network, and internal software
- Example of how to expand and get a better understanding – it depends on the inputs
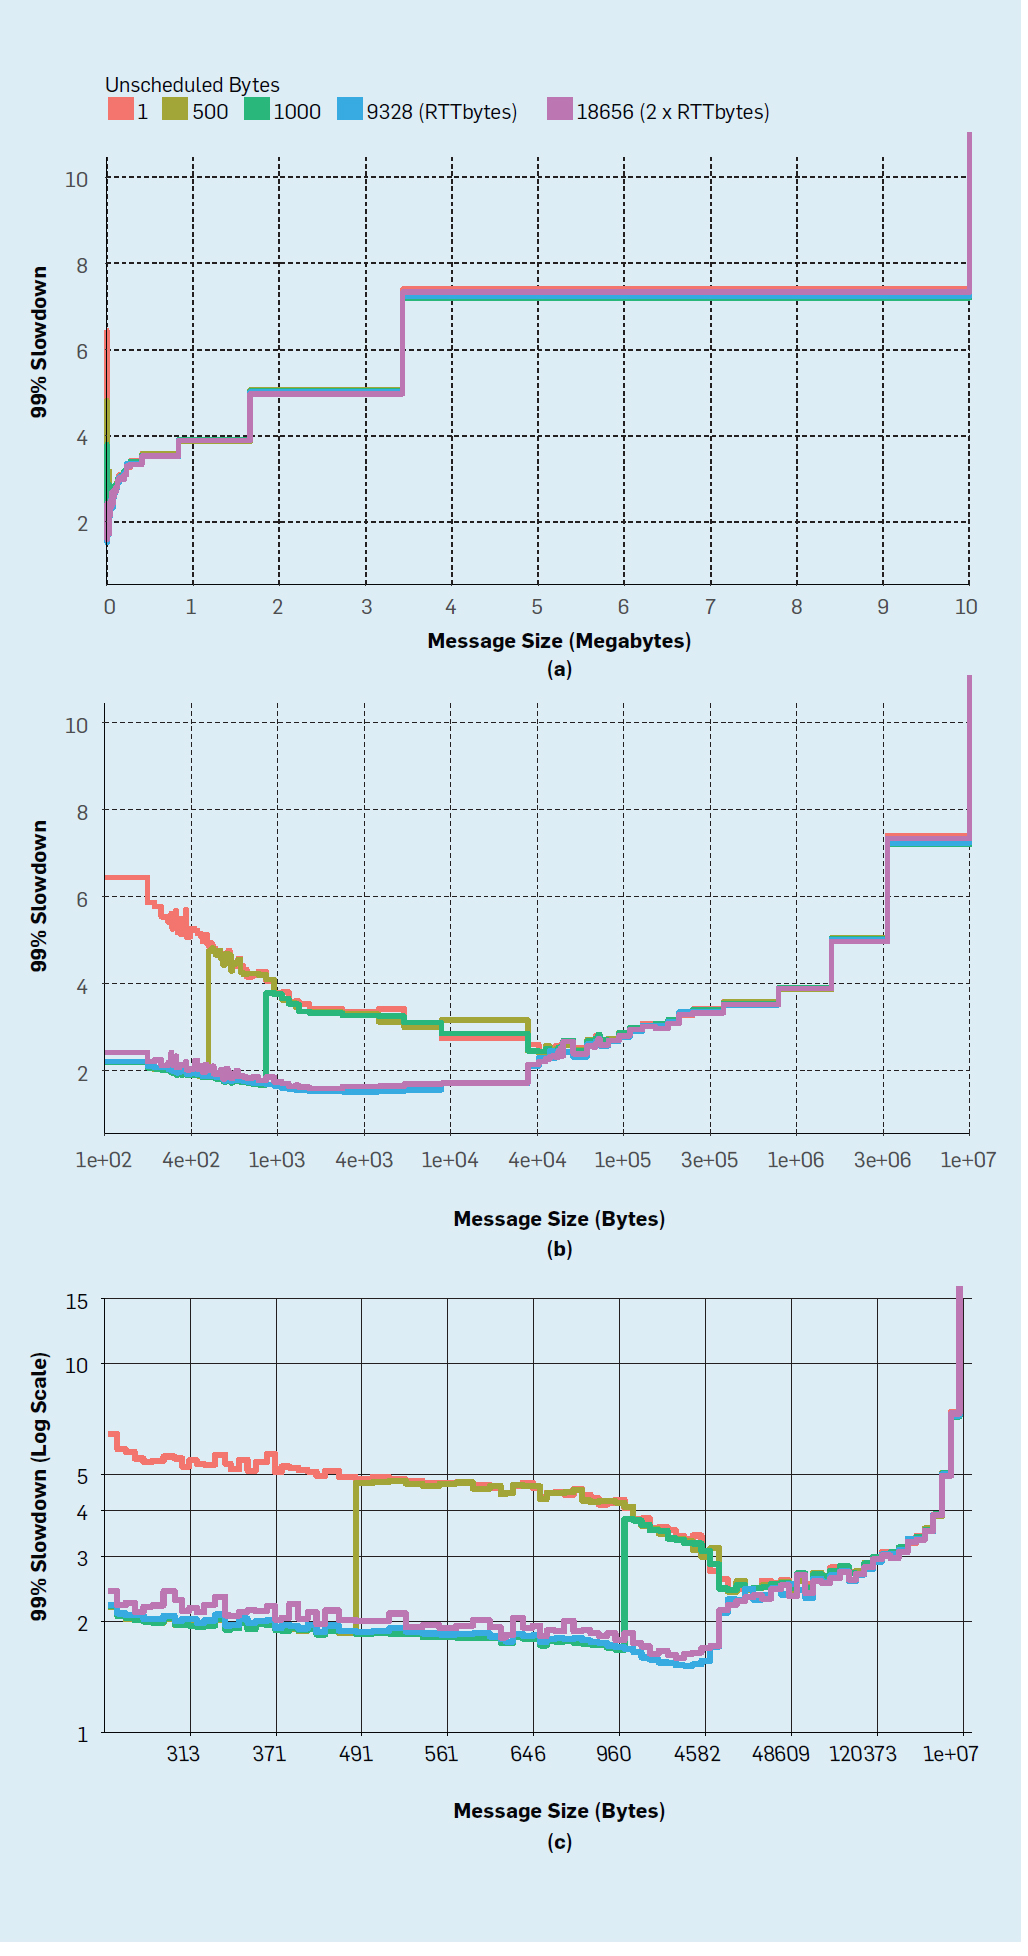
- Example of how to expand and get a better understanding – it depends on the inputs (this time, you have to split the x into equal parts)
Final thoughts
This is a very good read. Performance is something that you iterate on. It’s quite a process that’s simple on the surface: make assumptions, create benchmarks to verify that claim. But the reality is different:
- Make infrastructure to benchmark
- Performance process
- think of what to important variables to observe from the system (mostly throughput/latency)
- back up with benchmark
- the initial numbers - end to end numbers (process one request)
- the subnumbers (network/storage/processing)
- compare against other to check if the values are in appropriate range
- repeat
Enjoy Reading This Article?
Here are some more articles you might like to read next: