Machine Learning with League of Legends - Minimap Detection (Part 2)
Links to series
Updates
- This was made back in March 2020 right as COVID hit. After over a year of forgetting to upload this post, I finally uploaded.
- [2021-09-06]: Added section under Related Work on League-X and League-X Evaluation.
Background
As mentioned in the last post, there were some problems that needed to be addressed:
- Detect champions even when the champions are partially obscured
- Pings can overlap
- Boxes can too
- Lower detection of false positives / false negatives
In addition to keeping to these standards, we want to:
- Detect champions accurately (bounding boxes are correct)
- Detect all possible champions
Two key components are necessary to train the machine learning model, which will reach our expectations:
- Image of minimap
- Positions of the champions on the minimap
Abstract
This blog explores existing/current work related to minimap champion detection. Prior attempts fail, being built off of limited and biased data. I will show you in this blog how to build a simpler model trained on easy-to-obtain data that outperforms the existing work by overcoming data limitations. An extensive evaluation is done to show that my method is much more robust over existing work with the ability to detect all champions.
Related Work
There has been previous work that attempted to solve the problem of detecting champions on the minimap.
DeepLeague
DeepLeague was one of the first projects at an attempt to detect champions on the minimap. On January 2018, the author, Farza, released DeepLeague that uses deep learning to detect champions on the minimap. His source code is located here.
Farza gathered data from professional games that were streamed live (back in 2018, streams sent champion data including position from a websocket). Using the positions and the image of the minimap mined from the streams, Farza was able to train a YOLO9000 model that could accurately detect champions on the minimap.
However, Farza’s project does have some pitfalls.
- Relies on a biased data source.
- Professionals tend to choose to play certain champions over others. Therefore, some champions may not even appear in the image dataset.
- Data source is unstable
- What if the data source (data being streamed via websocket) is down or has been changed or removed?
- League of Legends is a game that is always being updated. New champions will be created and professional streams may take a certain amount of time off. Therefore, updates to the object detector can be delayed.
- Only is able to detect
56champions- Farza does not mention this, but his object detector only detects up
56champions. When Farza posted his blog on Medium onJan 23, 2018, Zoe was the lastest champion that was released, meaning that were ~140champions released already during that time. This means that his object detector is only able to detect up to40%of all champions in League of Legends.
- Farza does not mention this, but his object detector only detects up
- No metrics
- There is no metric on how well the detector works. How well does the detector work overall? How well does the detector work in situations where there are overlapping champion images?
- The only metric is to look at the GIFs that Farza has posted
- Analysis of GIF images
- From the both GIF images, it seems like Shen
 fails to be detected frequently when another champion overlaps Shen.
 - Gragas
 from the first image doesn’t have fully centered bounding box at times, especially when the champion is moving.
 - Cho’Gath
 from the second image is incorrectly labeled as Karma
  because professionals do not play Cho’Gath often, so Cho’Gath appears rarely in the dataset. Farza also mentions that this as a problem as well.
 - I cannot “evaluate” how well the detector works when pings overlap champions because the GIFs do not show an example.
- From the both GIF images, it seems like Shen
PandaScore
PandaScore improved on Farza’s work and pushed their work into production as an endpoint for their service for customers to be able to request data from. In their blog, they trained an initial model, much like Farza’s approach. However, with a higher bar to raise, they wanted a model that could generalize to any champion.
The approach they had boiled to:
- Splitting up the minimap into tiles (So, for example the 512x512 size minimap could be cut into 26x26 squares)
- For each tile, use a classifier to determine what champion is in the tile (or if there isn’t a champion at all)
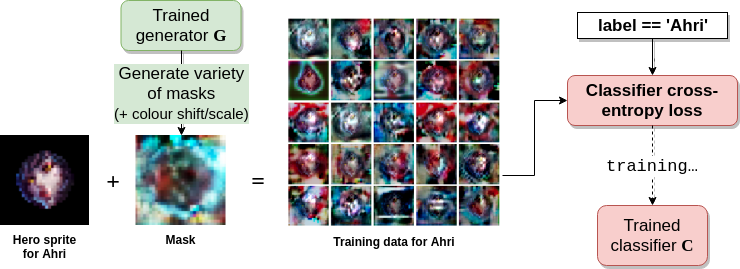
- The classifier was built using a GAN (Generative Adversarial Network), which helps create a better classifier by modifying the tile with noise (manipulating pixels) to be able to detect champions in situation where the other images partially overlap the champion image.
- Use another model Convolutional LSTM, which allows the program to memorize and predict the champion’s position even if the champion image has been entirely covered by another image.
Their approach seems to work pretty well at first glance.
It handles overlaps such as pings and always detects champions.

However, it does have pitfalls as well.
- Over-engineering
- This approach is complex: splitting the minimap into grids, running a classifer per tile and then running the Convolutional LSTM model to generate the coordinates. Farza managed to run a single object detection system to obtain champion positions.
- Relies on a data source
we trained on our own dataset of around 80 games, that was obtained in a similar way to that described by Farza- Again, what if the data source is not avaliable or outdated?
- Not really “accurate”
95% of all detections are within a 20 pixel radius of the target- The statement is may be true, but do we really want positions to be constantly offseted from where the icons actually are? 20 pixel radius can be considered a pretty big range on a 512 x 512 minimap.
- Upon closer inspection of the gif, it seems like most of the position of champions are not centered, especially when the champion moves (the detection starts to lag behind).
- No metrics
- The only metric given is their statement that
95% of all detections are within a 20 pixel radius of the target
- The only metric given is their statement that
- Analysis of GIF image
- In many cases, many of the detected champion’s positions are not centered and even seem to drift as champions move.
- When Camille
 moves rapidly in different directions near Ornn
  , her detected position seems locked in place. The same occurs for the four champions in the bottom right hand of the minimap.
League-X
League-X is a project on github that focuses on detecting champions on the minimap (has no blog explanation unlike above).
Reading the source code, the workflow is as follows:
- Dataset Generation
- Creates a train test split from images
- What kind of images? From a very small cropped image per champion in the game
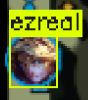
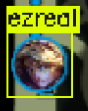
- Sample of an image taken from dataset of Ezreal

- Sample of an image taken from dataset of Ezreal
- I presume the author manually cropped these from the game as the directory contains ~80 images per champion and has some background image from the river and bushes
- What kind of images? From a very small cropped image per champion in the game
- Creates a train test split from images
- Training
- Trained using small 2 layer Conv2D model which outputs a softmax over all possible champions (0 - 100% confidence) given an image
- Execution
- Uses Hough Circles algorithm in the OpenCV image processing library to detect circles with some size (matching champion icon sizes) on the minimap
- Any detected circles are captured and cropped out and forwarded to the model to predict possible champions in the cropped image
- Outputs an image containing detected champions
- Issues
- “League-X currently supports 131/149 champions in League of Legends, we will add support to more champions in the future.”
- The author manually has to gather data and label the information
- Is time consuming and not scalable
- The author manually has to gather data and label the information
- No metrics similar to above
- Data is not enough varied enough (not enough data)
- Influences how well champions are detected under certain conditions (overlay, mouse hovering)
- “League-X currently supports 131/149 champions in League of Legends, we will add support to more champions in the future.”
Recap
The problems mentioned in previous approachs:
- Depends on existing data
- Cannot handle overlapping images well
- Cannot detect all champions
- Does not detect champion positions accurately
- Over-engineered
And most unassuring of all:
- No evaluation
Setup
To tackle the problems, I want my approach to do the following:
- Generate my own data
- Fixes
- Depends existing data
- Cannot detect all champions
- Cannot handle overlapping images well
- Fixes
- Use a single model to detect all champions on the minimap
- Fixes
- Does not detect champion positions accurately
- Over-engineering with machine learning techniques
- Fixes
Note this focuses on league patch 10.7. Future versions of the game can be different – map layout, champions, etc…
Generating data
What do you mean generate your own data? You need people playing a game, right?
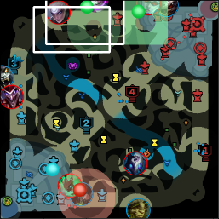
A trick I came up with is to simply generate a possible image of the minimap that mimics a real scenario as close as possible.
At first glance, it may seem like a image of a mininmap from a real game, but upon closer inspection, one can see that champions are out of place, some lane minion locations does not make sense and pings are oddly placed.
Below is a walkthrough of the pipeline for generating the images:


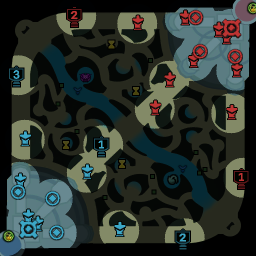
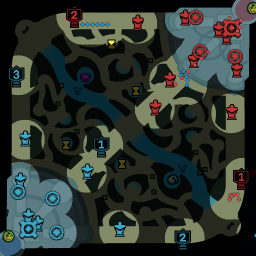
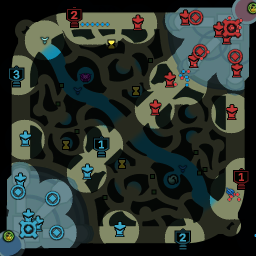
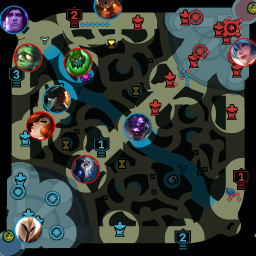

In addition, to be able to handle detect overlapping champions well, the image generator frequently attempts to overlap champions partially with other champions, pings and lines.
Now, images of a minimap can be generated infinitely! There is no need to constantly find a reliable datasource, parse information and store the results somewhere.
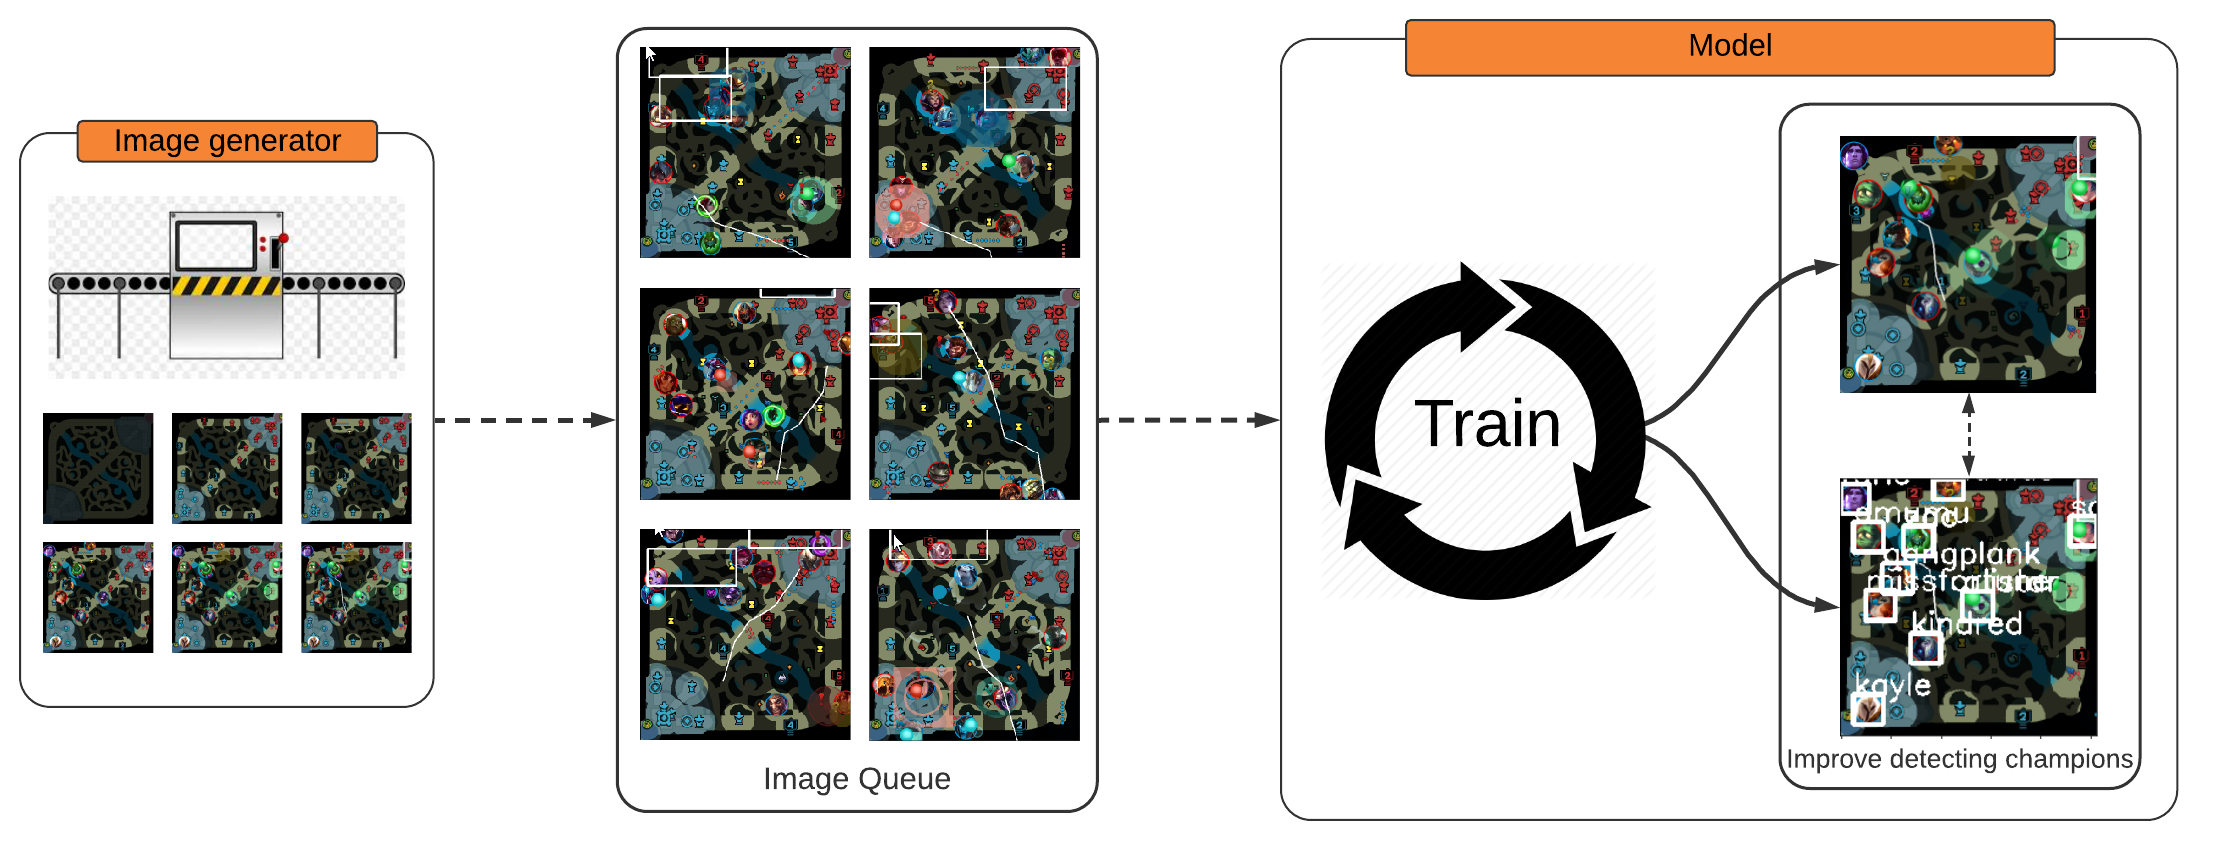
Architecture
Now that there is a way to continuously generate images, we can build a system to quickly train our model.
The system will be split into two parts:
- a generator that produces images
- a model that takes in the generated images and trains on them.
The generator will fill in a thread-safe multi-producer, multi-consumer queue and the model will take from the queue. This allows the generator and the model can work (mostly) independently from each other instead of the model waiting for the images to be generated and visa-versa.
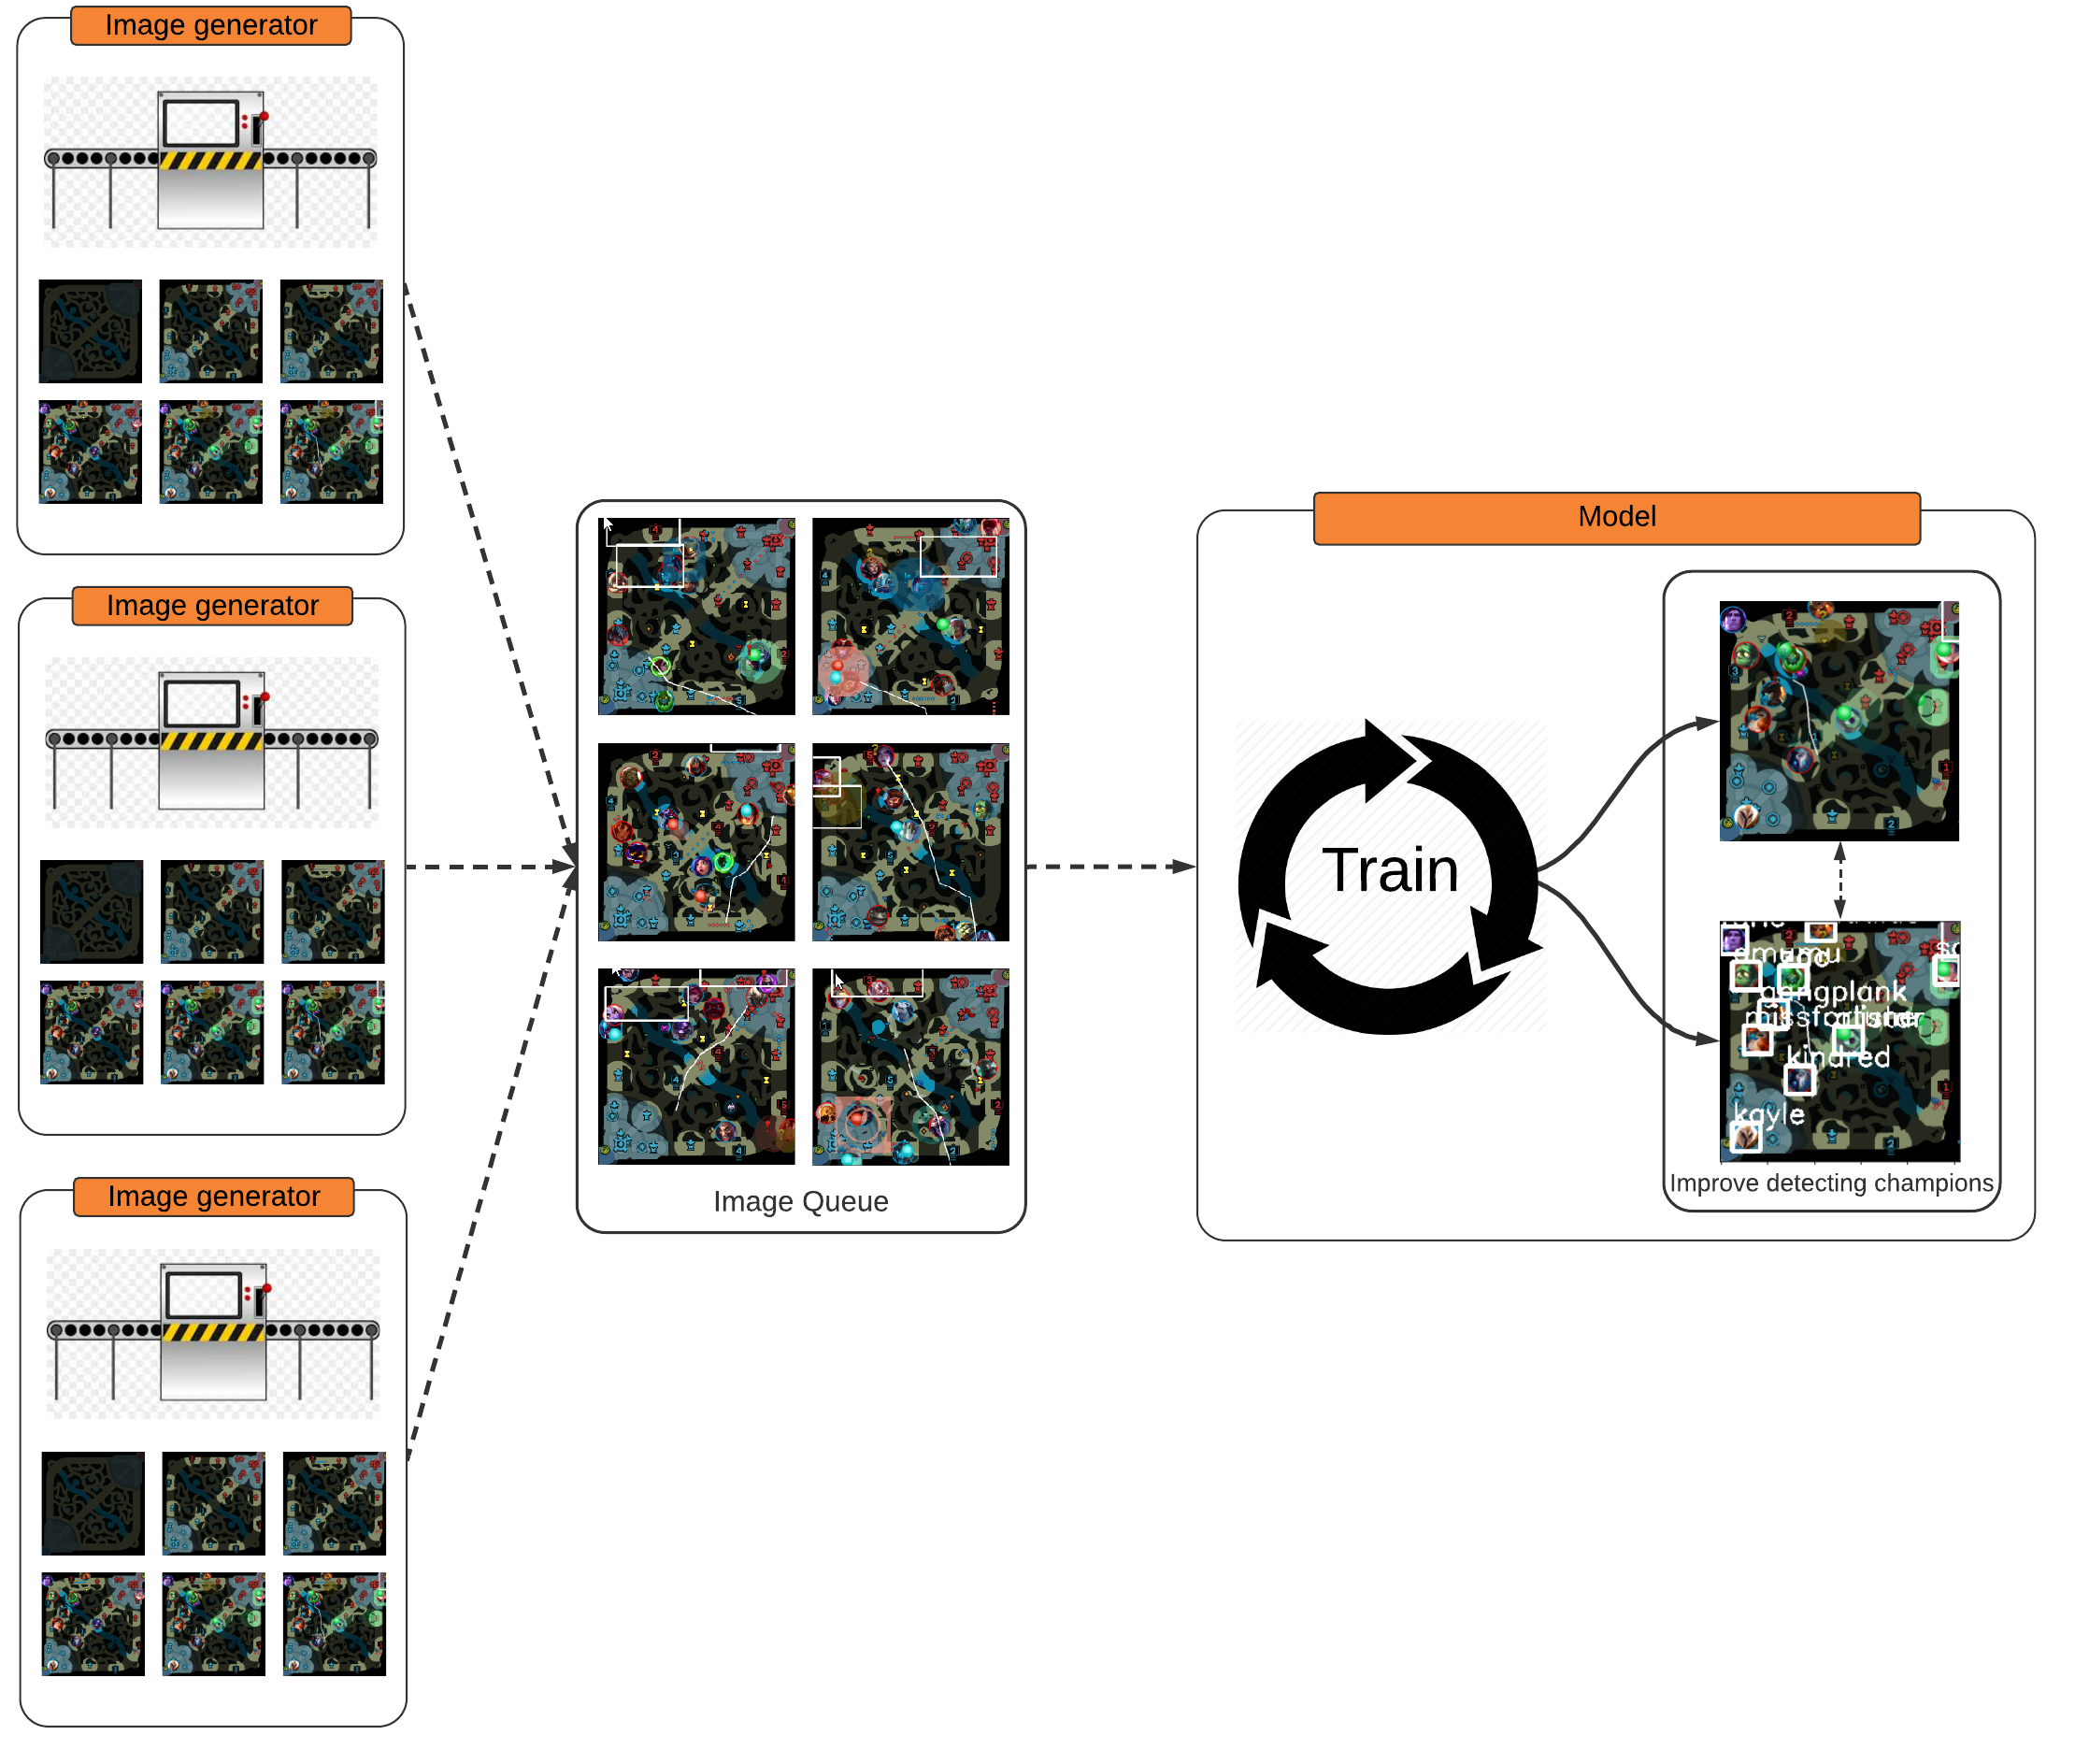
Since the generator operates independently, the generator can be replicated many times to generate different images at the same time and they can fill the same queue.
Model
There are many models that can be used for object detection. Some of the more popular architectures currently include YOLOv3 and Faster R-CNN.
Let’s keep things simple. I will use the Faster R-CNN ResNet50 model used in the pytorch object detection finetuning tutorial from official pytorch website. However, in this case, there are slight changes; the model will not be fine-tuned, but trained from scratch.
In 1 - Finetuning from a pretrained model, modifications are made to train the model from scratch and detect the correct number of classes.
model = torchvision.models.detection.fasterrcnn_resnet50_fpn(pretrained=True)pretrained=True needs to be set to False
num_classes = 2 # 1 class (person) + backgroundnum_classes needs to be set to 1 + 148, which is the background + total number of total champions currently in the game.
Result code:
import torchvision
from torchvision.models.detection.faster_rcnn import FastRCNNPredictor

# load a model pre-trained pre-trained on COCO
model = torchvision.models.detection.fasterrcnn_resnet50_fpn(pretrained=False)

# replace the classifier with a new one, that has
# num_classes which is user-defined
num_classes = 1 + 148 # (total number of champions as of current)
# get number of input features for the classifier
in_features = model.roi_heads.box_predictor.cls_score.in_features
# replace the pre-trained head with a new one
model.roi_heads.box_predictor = FastRCNNPredictor(in_features, num_classes)
Evaluation/Results
Image generation
On an Intel i5 CPU with 4 cores with a SSD, image generation takes on average about 0.066802 seconds per generated image with a single thread. With four threads running, it is about 0.033279 seconds per image. That does not sound not too bad, a 2x increase in speed!
Why not 4x since there are four threads and the CPU has 4 cores? Time to investigate. Hmm, perhaps the queue may be the issue since it is the only object that is shared between threads? The measured average time per thread to put an image inside the queue is 0.000049402 seconds, so the queue does not seem to be the issue. After much thought, the bottleneck probably must come from the Global Interpreter Lock, which prevents multiple threads from executing the same python code at the same time. Anyways, I probably should not discuss it further.
Oops, oh well. I used threading instead of multiprocessing, but, at least I had a two fold increase in overall speed by using threads.
Code to calculate average time spent for single thread (1000 images):
times = []
# generate 1000 images
for i in range(1000):
    # calculate the time it takes to run generation per image
    start = time.time()
    GenerateImage()
    end = time.time()

    diff = end - start
    times.append(diff)

# calculate the mean
mean = np.mean(times)
print(mean)
Code to calculate average time spent for four threads (1000 images):
start = time.time()

# four threads are running in background, generating 1000 images
system = GenerateImagesAsync(1000)

sleep()

# wait for queue to be full
while not system.queue.full():
    # try to not constantly hold a reference to the queue by checking if it is full
    time.sleep(0.05)

end = time.time()

# calculate difference
diff = end - start
print(diff)
The model training speed is another factor to evaluate.
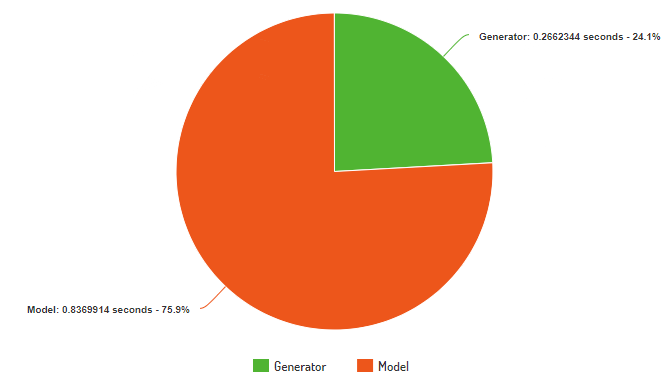
The average time per iteration (image generation + model training) is 1.10322 seconds (calculated dividing total time spent training by the number of iterations).
With image production being so quick, model training now becomes the bottleneck by taking 0.83699 seconds per iteration and 0.26623 seconds for generating eight images in one iteration.
This is calculated by subtracting the average time spent per iteration from the time it takes to generate one image multipled by the number of images necessary for a model iteration.
0.033279 * 8 = 0.26623 where 8 is the number of images generated in one iteration. The final number is the average time spent per iteration generating images.
1.10322 - 0.26623 = 0.83699. Subtract the total average time per iteration by the time spent generating images and the result is the time spent by the model updating its weights.
Model
Loss graph of training model:
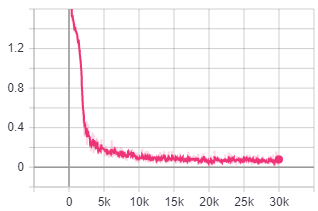
The model was trained for 8 hours.
As one can see, the model’s loss is decreasing, which means it is hopefully learning something!
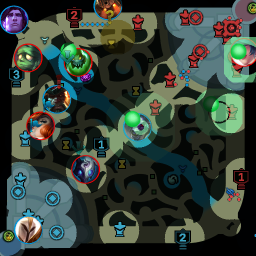
Let’s check if it actually learned to detect champion positions.
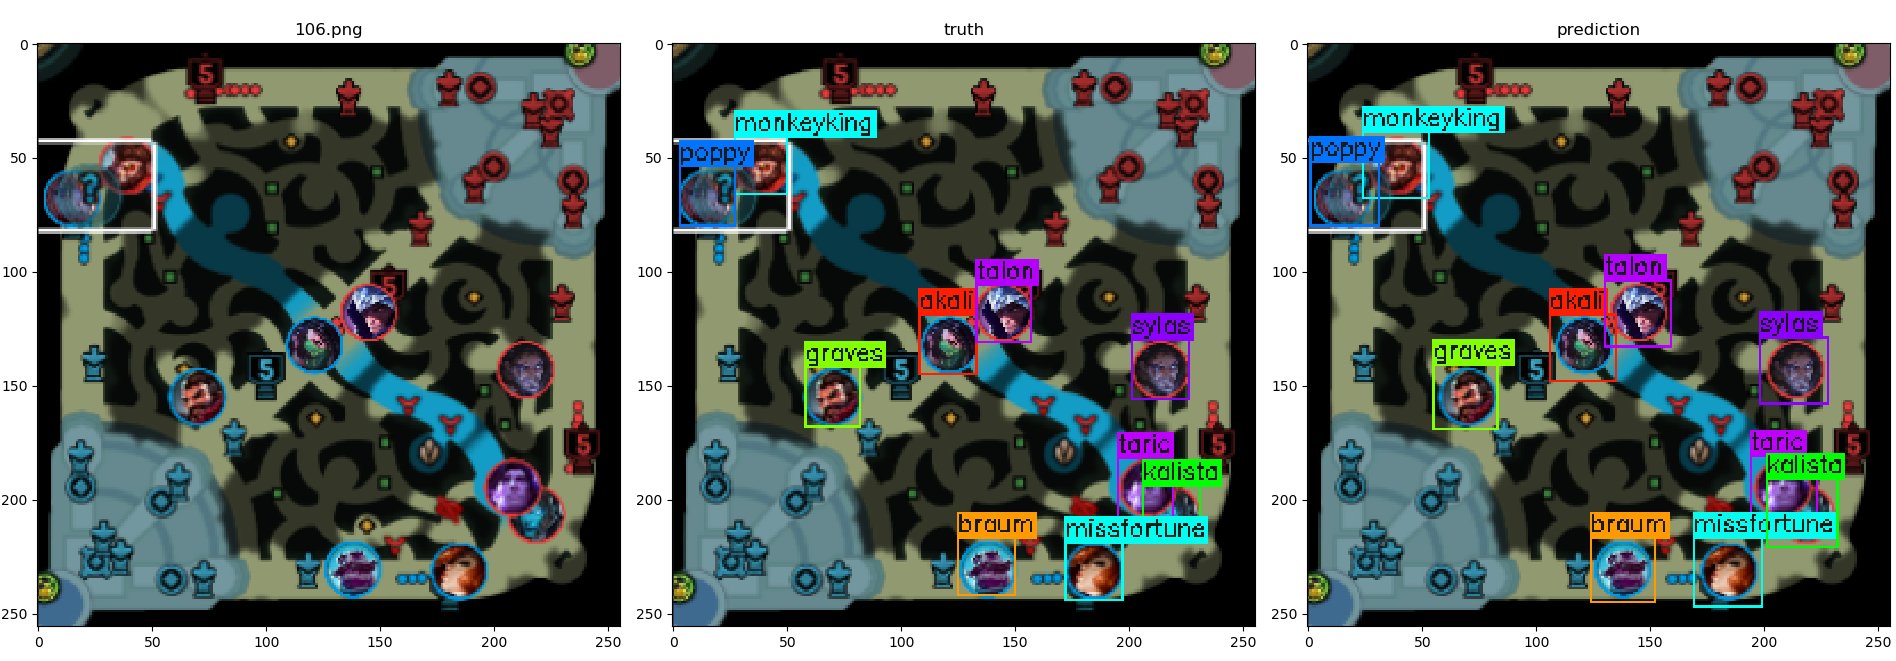
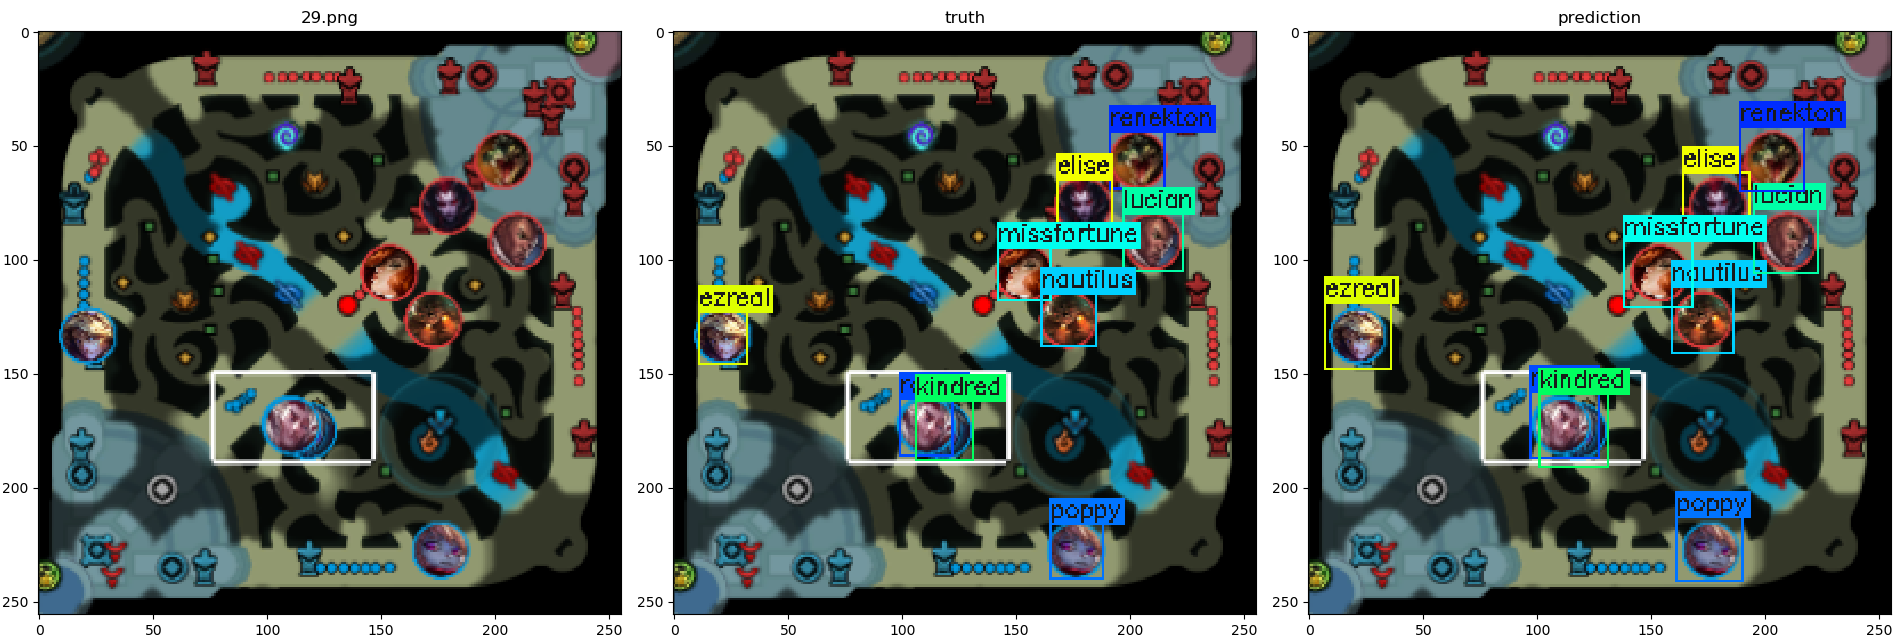
How well does the model perform in a game in real-time?
However, evaluating an object detector by observing an image or a GIF is not a sufficient metric.
Metrics
I hand labeled 150 images, resulting in 1213 champions labeled. I used labelImg as a tool to label the images. Each of these images have a corresponding bounding box and label. Labeling took a couple of hours.
One question might ask: Why not use Farza’s dataset of over 100,000 labeled images instead?
Farza’s dataset does not have accurate bounding boxes. The bounding boxes do not tightly fit the bounding box of tha champion icon. In addition, I cannot make sure that the dataset has errors or the labeling is up to standard since I did not label the images myself and the labels were automatically generated.
Some background terms before moving forward:
- IoU - Intersection over Union is the overlap between the predicted bounding box against the ground truth. The higher the IoU, the closer predicted bounding box is to the ground truth bounding box. The value ranges from
0.0to1.0.

- Score - This is an output from the object detector, which measures how confident what the object the object detector has predicted. Basically, how sure am I that the bounding box contains an picture of, say, Ezreal
 ? This value ranges from
 0.0to1.0.
Graphs:
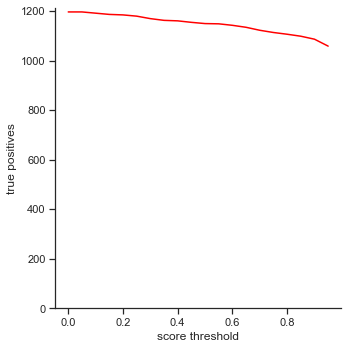
The rows is listed in the order of: true positives, false positives, false negatives, extra champions detected, precision, recall, accuracy iou, and accuracy in 5 pixels.
- True positives - The number of champions detected out of all ground truth champions in the images.
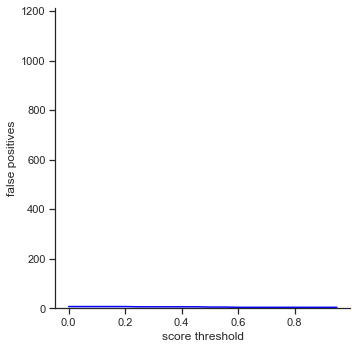
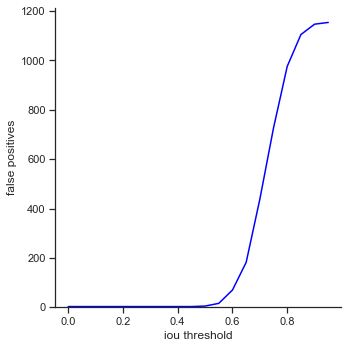
- False positives - The number of champions detected with an IoU less than the IoU threshold. This is based on the most popular object detection metrics repository on github
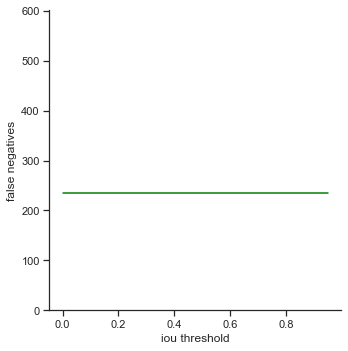
- False negatives - The number of champions that were not detected in the images, but the champions actually were in the ground truth images
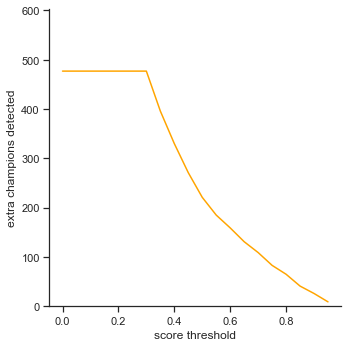
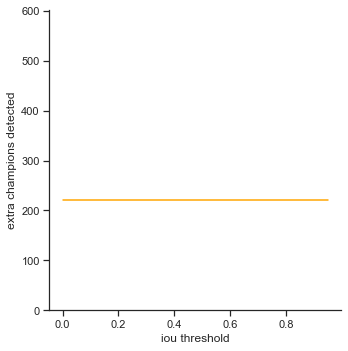
- Extra Champions Detected - Champions that were detected, but were not in the image. This can count as a false positive, but the top two most popular object detection metrics repository calculate a false positive only on IoU. Here and here
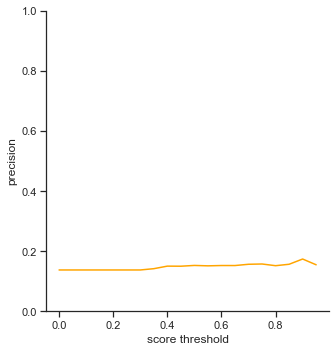
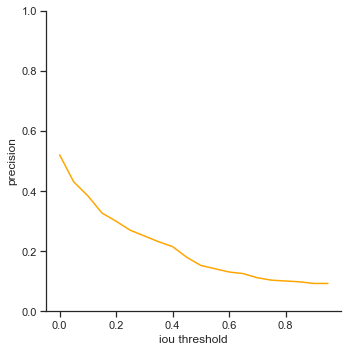
- Precision - How accurate were the predictions? This is measured as
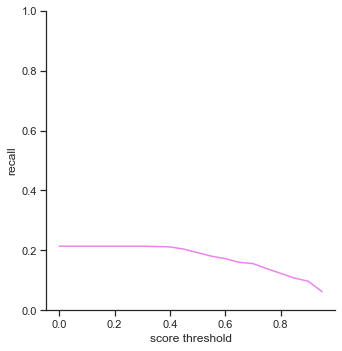
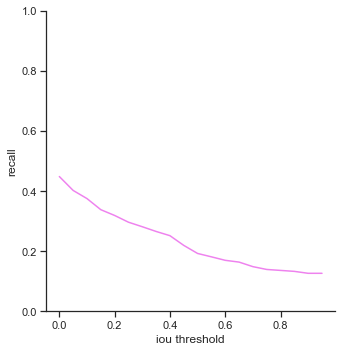
true positives / (true positives + false positives) - Recall - How well can the objects be detected? This is measured as
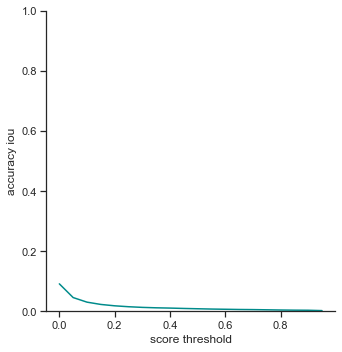
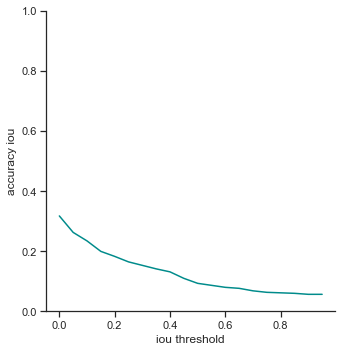
true positives / (true positives + false negatives) - Accuracy IoU - The percentage of the number of champions detected out of all ground truth champions that have an IoU over the threshold.
- Accuracy in 5 pixels - The percentage of the number of champions detected out of all ground truth champions that have a bounding box within 5 pixels. This means that the four points constructing a predicted bounding box is within 5 pixels of the ground truth bounding box’s four points.
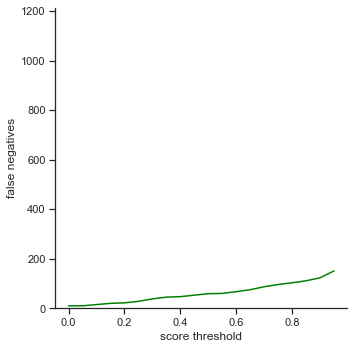
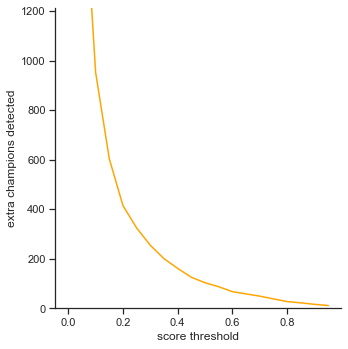
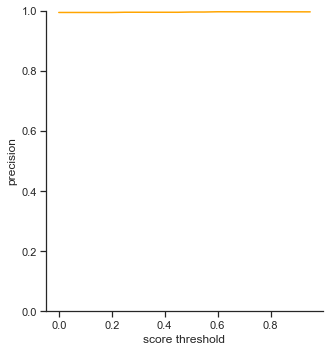
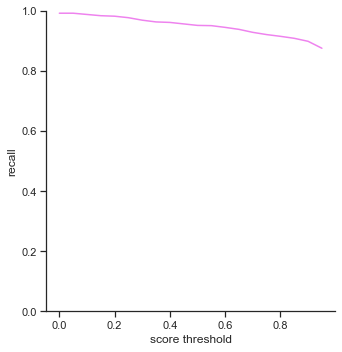
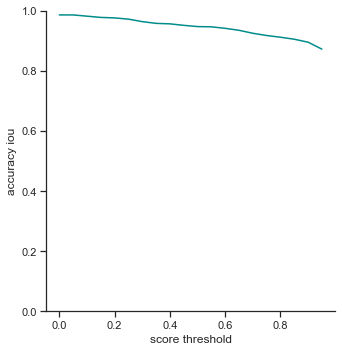
The left column measures each attribute as score threshold increases by 0.05 from 0.0 to 1.0. Remember that score threshold measures how confident the classifer predicts that the object in the bounding box is a certain champion. The IoU is set to 0.5.
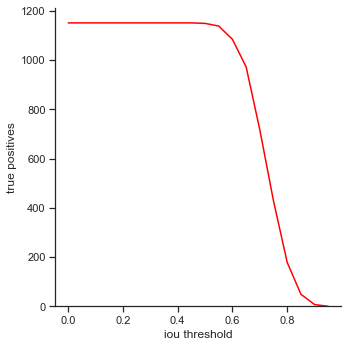
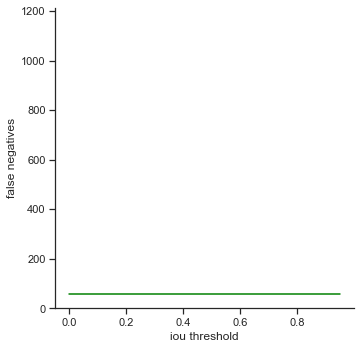
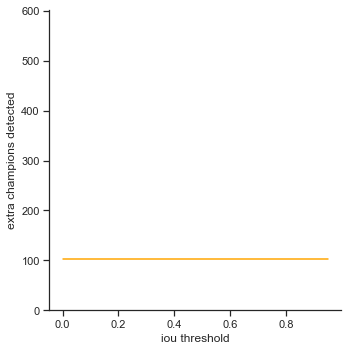
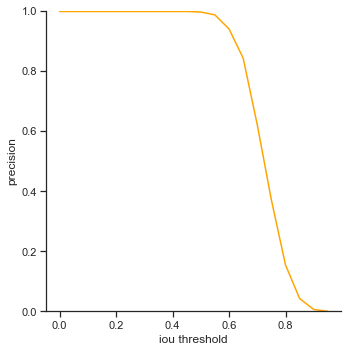
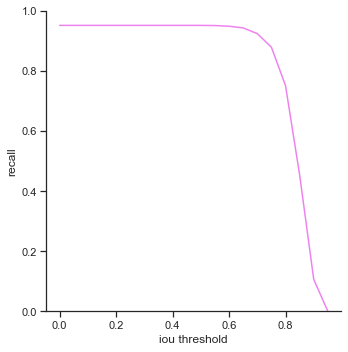
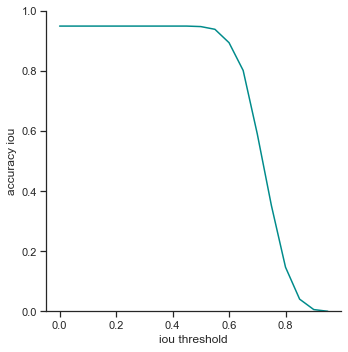
The right column measures each attribute as IoU threshold increases by 0.05 from 0.0 to 1.0. Remember that IoU threshold measures close the predicted bounding box is to the ground truth bounding box. The score threshold is set to 0.5.
There are some interesting points to take away from the graphs.
Score threshold graphs:
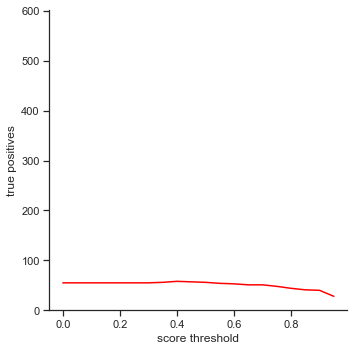
- True positives - Slowly decreases as score threshold increases because the object detector has to be more confident in its predictions
- False positives - Does not change. IoU is not changing, so number of false positives does not change. Since false positives is related to precision, precision does not change as well.
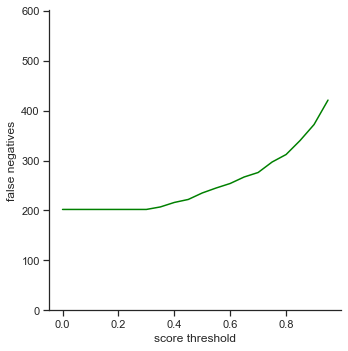
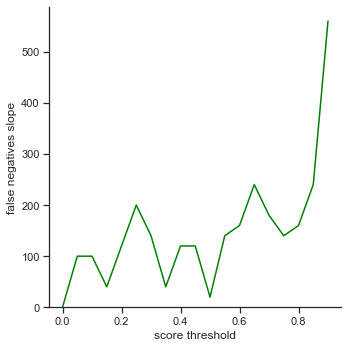
- False negatives - Slowly increases as score threshold increases. Same reason as in True positives. Less champions are detected because the object detector is less confident in some cases. This affects the recall graph as well, which exhibits a similar result
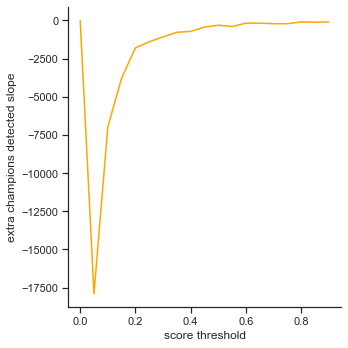
- Extra champions detected - Decreases as score threshold increases like a log graph. As the object detector becomes more confident in its classifications (score increasing), it has to be more sure that the champion in the bounding box is actually the correct champion.
- Accuracy IoU / Accuracy in 5 pixels - Both decrease as score threshold increase, like the graph for true positives. What is interesting is the Accuracy in 5 pixels’ values. On average, the bounding boxes are in 5 pixel range
80%of the time.
IoU threshold graphs:
- True positives / precision / recall - Decreases rapidly at the end. It seems like IoU makes a difference dramatically when IoU is high. This is good as it means that the object detector makes a lot of bounding box predictions close to the ground truth bounding box.
- False negatives / Extra champions detected / Accuracy in 5 pixels - Do not change. These attributes are not affected by IoU because they only depend on whether or not the object is detected (not dependent on IoU).
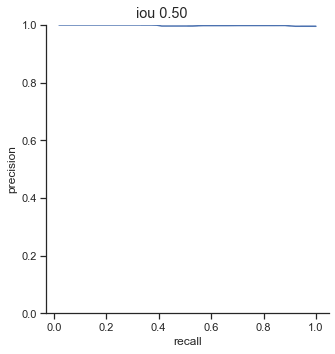
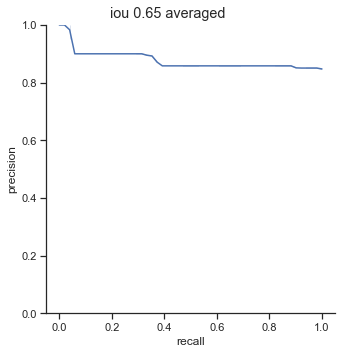
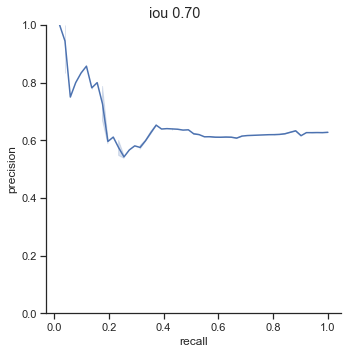
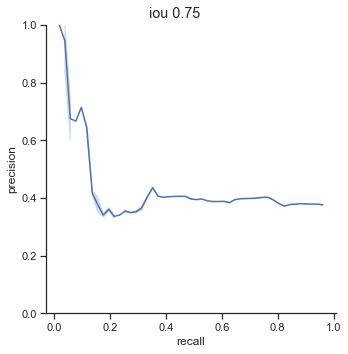
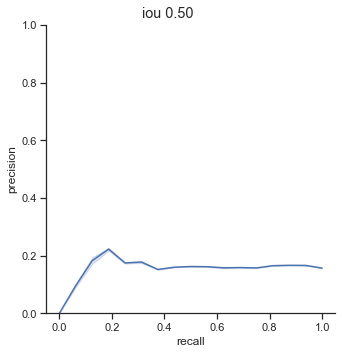
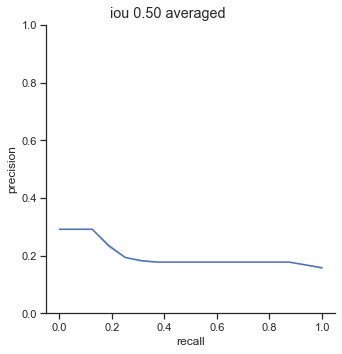
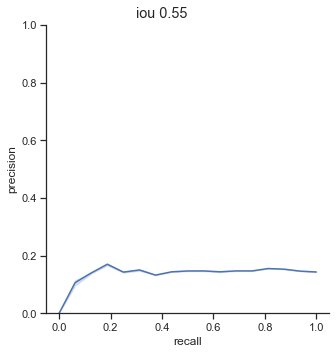
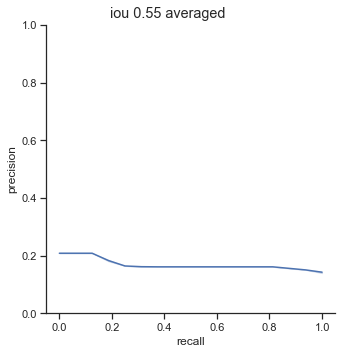
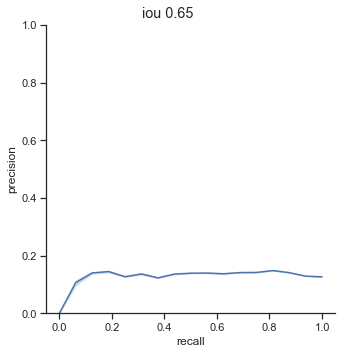
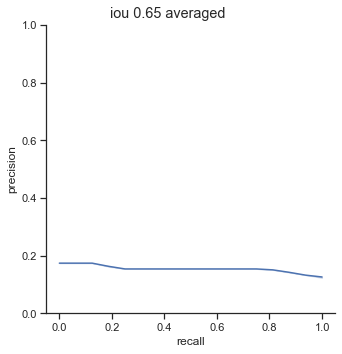
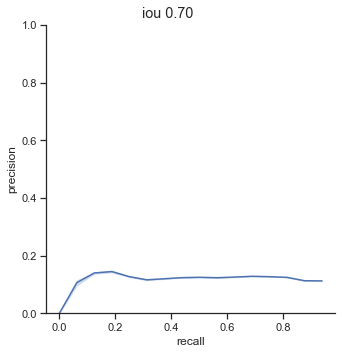
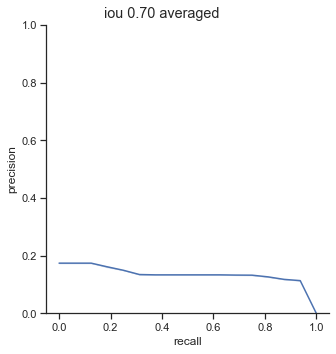
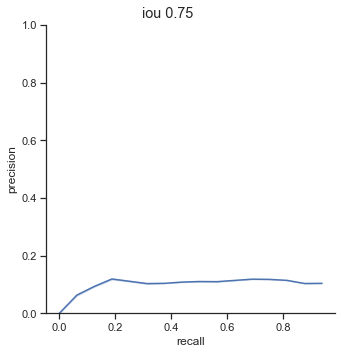
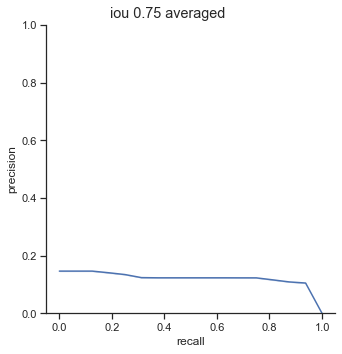
A standard metric in object detection is AP/mAP (Average Precision/Mean Average Precision). Essentially, the value corresponds to the area under the precision-recall graph. The higher the value, the better the object detector is. Why? If the area under the precision-recall graph is large, it means that precision stays high as recall increases. AP can be measured at different IoUs, which I will show and analyze. The AP formula I will be using is here, which is a python adaptation of PASCAL VOC2012 challenge AP formula. The AP calculation is done by sampling points from the precision-recall graph.
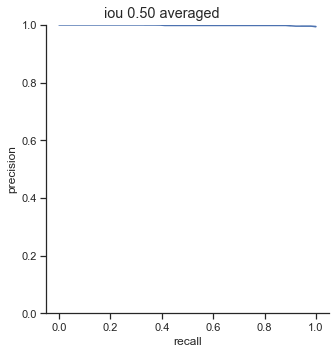
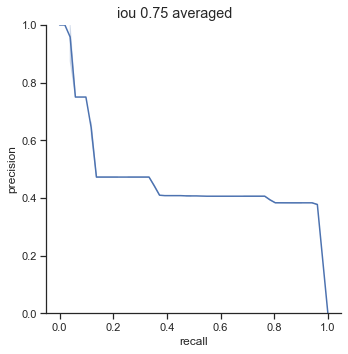
The left column is precision-recall graph before the AP calculation is done. The right is the graph after the AP calculation is done. As one can see, the AP calculation samples from the graph to perform its calculation and as a result, “smooths” out the graph.

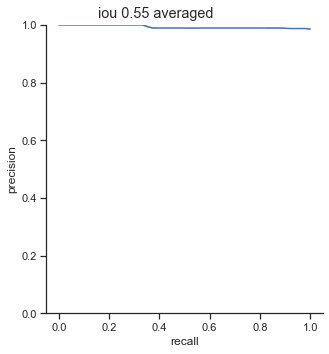
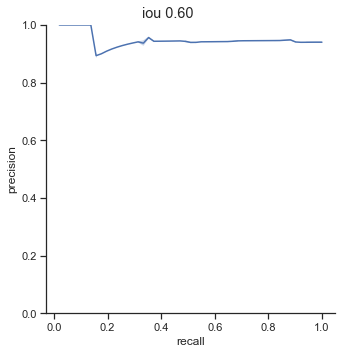
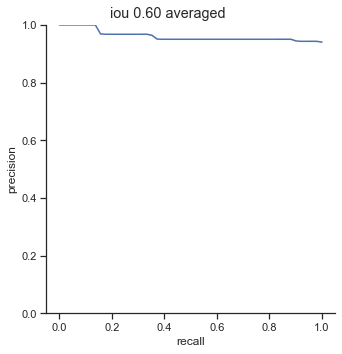
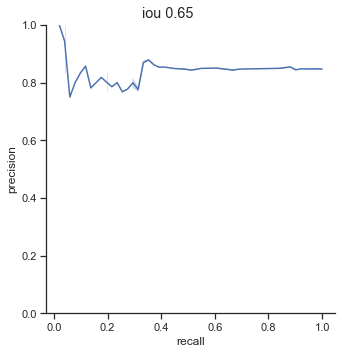

AP calculation per IoU
| IoU | AP |
| 0.50 | 0.999 |
| 0.55 | 0.993 |
| 0.60 | 0.961 |
| 0.65 | 0.877 |
| 0.70 | 0.693 |
| 0.75 | 0.452 |
One interesting point to notice is that AP dramatically decreases from 0.65 to 0.75 IoU thresholds. The AP at 0.75 IoU is substantially low, considering that the AP for 0.75 IoU for the COCO dataset (detection for common objects – humans, cars, bags, chairs, etc…) is 0.585 (at this time of writing). The COCO dataset is a substainially harder dataset, so why is the AP so low for detecting champions?
I suspect the issue is due to my image detection size. The images I feed are 256x256 pixels in size and champions are, on average, 25x25 pixels in size. This means that IoU values can change in huge intervals when bounding boxes shift by one pixel.
In addition, ground truth bounding box labels are tight while the object detection system bounding boxes are larger. Because the predicted bounding boxes are usually larger than ground truth bounding boxes, there is an increasingly smaller margin of error as the IoU threshold increases.
Another interesting point to bring up is the 0.90 - 0.99 AP range for 0.50 - 0.60 IoU. The AP is extremely high when the IoU is in these ranges. The AP should be higher for higher IoU thresholds.
I suspect that if the image size were to be larger, say 512x512, the AP at higher IoU thresholds such as at 0.75 would be higher.
Comparison as a metric
Graphs and numbers are great on their own, but a comparison would greatly benefit a person’s understanding in how well a system performs. For example, the speed of reading 1MB from memory averages around (250,000ns). How does one interpret the speed from just a number? By knowing the speed of reading 1MB from disk (20,000,000ns), it really gives a comparison to how much faster memory access is than disk access is (~80x faster).
Therefore, I am going to use Farza’s object detector as a comparison. I would compare Pandascore’s object detector as well, but the company has not released their work to the public.
I will perform the same evaluation techniques to his object detector and analyze how both object detectors compare. Farza feeds in 295x295 pixel images, which get rescaled to 416x416 pixels. My images are 256x256 pixels in size and are rescaled as well. Do note that some champion images have changed such as Fiddlesticks ![]() or have been introduced such as Sett
or have been introduced such as Sett ![]() since Farza’s release, so I have only considered the champions he has included in his dataset (56 champions) when detecting champions in my images. Here is the modified version of DeepLeague that does the evaluation.
since Farza’s release, so I have only considered the champions he has included in his dataset (56 champions) when detecting champions in my images. Here is the modified version of DeepLeague that does the evaluation.

To reiterate, the order of the rows is: true positives, false positives, false negatives, extra champions detected, precision, recall, accuracy iou, and accuracy in 5 pixels.
The left column measures each attribute as score threshold increases by 0.05 from 0.0 to 1.0. Remember that score threshold measures how confident the classifer predicts that the object in the bounding box is a certain champion. The IoU is set to 0.5.
The right column measures each attribute as IoU threshold increases by 0.05 from 0.0 to 1.0. Remember that IoU threshold measures how close the predicted bounding box is to the ground truth bounding box. The score threshold is set to 0.5.
Some keypoints to mention:
Score threshold graphs:
- True positives - Extremely low, being only able to capture
1/6of the ground truth champions. - False negatives - Increases expotentially as score threshold increases. My object detector increases linearly as score threshold increases.
- Extra champions detected - Interesting plateau in the beginning. The score threshold does not affect the graph until
0.3. - Accuracy IoU / Accuracy in 5 pixels - Extremely low. Accuracy in 5 pixels is almost zero, meaning that most of the bounding boxes most likely are not in a 5 pixel threshold.
IoU threshold graphs:
- True positives - True positives seem to be a lot higher at lower IoU thresholds. This means that his bounding boxes varies a lot larger than my object detector’s predicted bounding boxes.
- False positives - Has a similar curve to my graph, which is interesting.
- Precision / Recall / Accuracy IoU - Starts at a certain point and decreases linearly. My graphs stay at a certain point and then decreases. IoU values start to only affect my model over
0.6while all IoU values affect his performance.
Again, the left column is precision-recall graph before the AP calculation is done. The right is the graph after the AP calculation is done.


AP calculation per IoU
| IoU | AP |
| 0.50 | 0.200 |
| 0.55 | 0.169 |
| 0.60 | 0.166 |
| 0.65 | 0.155 |
| 0.70 | 0.133 |
| 0.75 | 0.119 |
The AP of Farza’s object detector at different IoUs are low. My object detector has ~4x his AP at 0.75 IoU (0.452 AP vs 0.119 AP). The difference is even more noticable at 0.50 IoU (0.999 AP vs 0.2 AP).
Comparison conclusion
My object detector significantly outperforms Farza’s object detector. The graphs and AP show clear differences between the performance of the two object detectors.
Some images show the difference in detail (left is Farza’s output, right is my output):
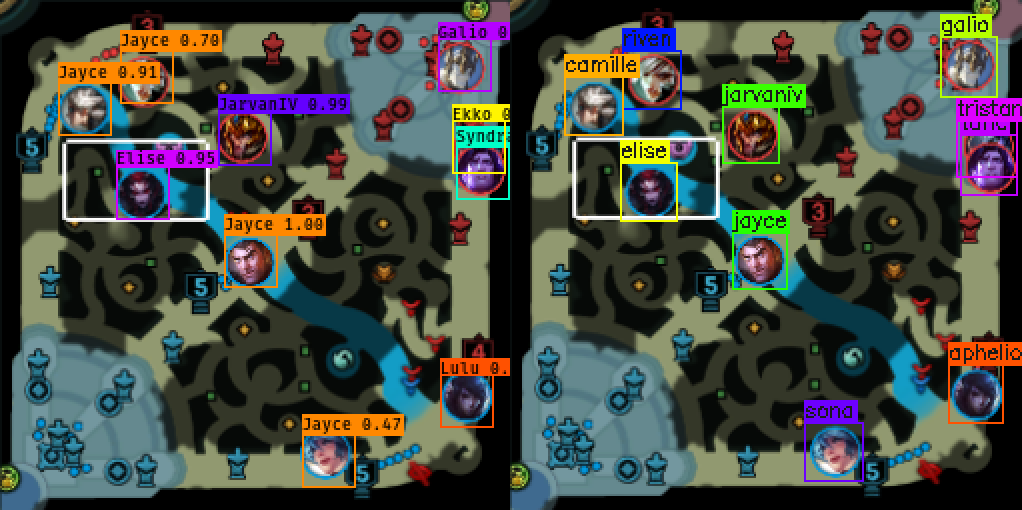
A lot of champions are detected as jayce ![]() . Seems like Elise
. Seems like Elise ![]() , Jarvan
, Jarvan ![]() , and Galio
, and Galio ![]() are detected with high scores (caused by Farza’s unbalanced dataset where these champions appear frequently)
are detected with high scores (caused by Farza’s unbalanced dataset where these champions appear frequently)
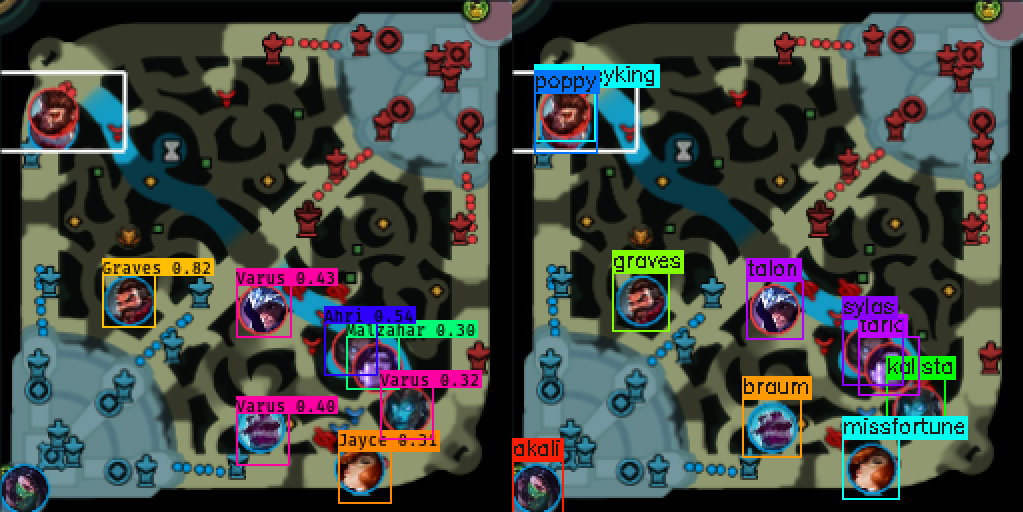
None of the champions detected are correct except for Graves ![]()
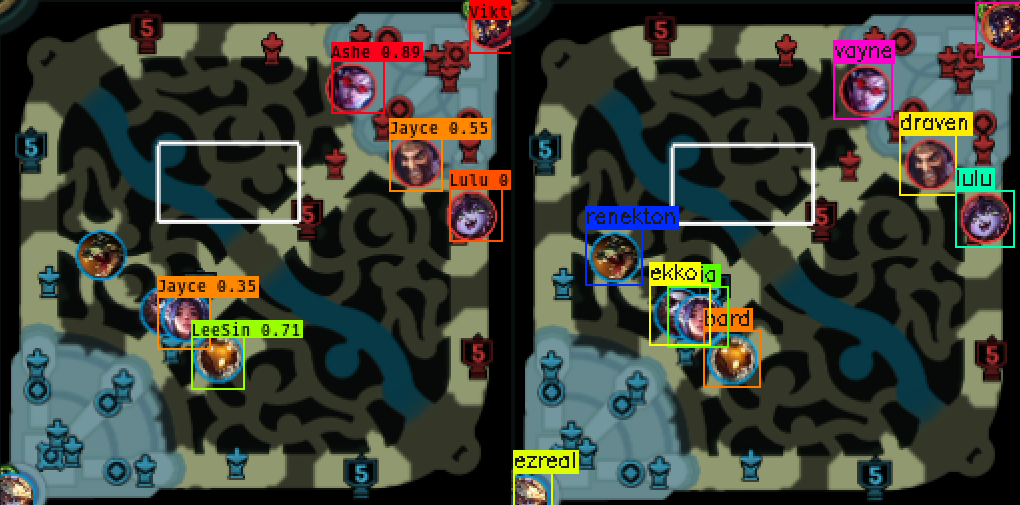

In the top image, Renekton ![]() is not detected, but Renekton
is not detected, but Renekton ![]() is detected in the bottom image. Renekton is not overlapped by anything in the top image. Looks like Farza’s object detector has trouble detecting champions in the bottom left corner where Ezreal
is detected in the bottom image. Renekton is not overlapped by anything in the top image. Looks like Farza’s object detector has trouble detecting champions in the bottom left corner where Ezreal ![]() is. In addition, Farza’s object detector seems to have trouble detecting Ekko
is. In addition, Farza’s object detector seems to have trouble detecting Ekko ![]() when Ekko is obscured by Irelia
when Ekko is obscured by Irelia ![]() in the top image.
in the top image.
Applying metrics
Metrics are not just there for show and tell! One can use them to optimize their system to get the best performance possible. Farza defaults his score threshold to 0.3. From the graphs, the threshold lands at a point right before the number of false negatives starts to rise and and right before the number of extra champions detected starts to decrease. Perhaps, he may have wanted to maximize recall.
What is the optimal score threshold that one should use? Well, it depends. Look at the extra champions detected graph and the false negatives graph. There is a trade-off. If one wants to be have less extra champions being detected, raise the score threshold. Else, lower the score threshold to have less false negatives.
Since the extra champions detected graph models like a log graph unlike a linear graph in score threshold, one should look more closely between the graphs to choose a value. Perhaps, find a point in the extra champions detected graph that has a slope that closely matches the slope in the false negatives graph to strike a good balance? 0.6 seems to be a good value where extra champions detected has a slope of -180 and false negatives has a slope of 160. (Note that the slope of extra champions detected is negative because the values are decreasing while the slope of false negatives is increasing because the values are increasing)
Conclusion
Going back to the problem list, this approach manages to:
- Be data source independent
- Handles overlapping images well
- Detect all champions
- Detects champion positions accurately (in a 5 pixel threshold)
- Simple (Model was built using two line change from a pytorch tutorial)
and provided:
- Metrics to show that it works well
- Performs significantly better than another system
Discussion and Future Work
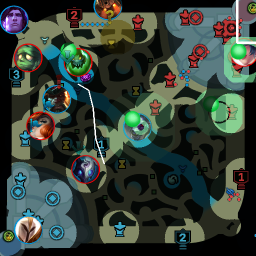
Why does the system not handle entirely covered champion images?
It simply does not need to. One can assume that champions that are not detected are still at their previous location because most of the time, the champion is mostly or fully obscured for a couple of frames. In the bot lane, one can observe that this occurs often, but the champions stay within close promixty in their position most of the time.
If it is necessary to approximate champion positions, one method is to use a Kalman Filter to produce estimates of the current positions using detected previous positions.
Why use FasterRCNN? Why not YOLO?
It was used in the pytorch object detection tutorial and was the simplest to adapt. Other models definitely can used in place of FasterRCNN such as YOLO (speed, model size).
What about detecting yuumi?
Yuumi ![]() is a champion that is able to attach to other champions, as shown below.
is a champion that is able to attach to other champions, as shown below.


As one can see, since yuumi disappears, the object detector cannot pick up on the fact that yuumi champion icon is not on the minimap anymore. The question then becomes: how do I detect yuumi when she attaches to another champion?
There are a couple of ideas I have in mind. One approach is to use classical computer vision techniques to detect champions with the special border (thus figuring out that yuumi exists). Another approch is to add a copy of all champions in league, but with yuumi added, so that the object detector can detect a champion with yuumi attached. So, for example, Ezreal with Yuumi would be a class that would be distinct from Ezreal. However, this approach doubles the amount of classes for the object detector to handle.
What about champions that can clone themselves?
Example of such champions that can clone themselves include Leblanc ![]() , Wukong
, Wukong ![]() , Neeko
, Neeko ![]() and Shaco
and Shaco ![]() . When these champions uses an ability to clone themselves, another champion icon of itself appears on the minimap, as shown below.
. When these champions uses an ability to clone themselves, another champion icon of itself appears on the minimap, as shown below.

In some cases, there can be assumptions made to detect the actual champions in these scenarios. For example, Neeko’s ![]() clone moves in a straight line and Wukong’s
clone moves in a straight line and Wukong’s ![]() clone stays still. However, there is not a perfect solution to solve these cases. Players are able to use the champions’ clone ability to trick other players into thinking the real champion is a clone. Players can also mimic what their clones perform by mimicing the clones’ actions. For example, Neeko
clone stays still. However, there is not a perfect solution to solve these cases. Players are able to use the champions’ clone ability to trick other players into thinking the real champion is a clone. Players can also mimic what their clones perform by mimicing the clones’ actions. For example, Neeko ![]() can move in a straight line like its clone and Wukong
can move in a straight line like its clone and Wukong ![]() can stay still alongside its clone. Thus, simple algorithms simply detecting clone movements can produce a significant amount of false positives.
can stay still alongside its clone. Thus, simple algorithms simply detecting clone movements can produce a significant amount of false positives.
Why use CNNs when you can use something less complex?
This was primarly a learning experience for myself; The goal was not meant to be a perfect end-to-end solution. There are definitely other better ways to handle problem like the previous post with computer vision techniques (using way less resources, which is incredibly important in running the program alongside a live game).
Why use Faster R-CNN ResNet50 when you can use something less complex?
Yup. This is a huge model. Why use it? Cause it was part of the torchvision tutorial and was exteremely easy to modify to get working. Could definitely use something way less complex as a model. For example, yolo :)
Where is the evaluation on FPS?
Approximately around 20-30 FPS on my machine (4 cores, 2060) playing a game in real time. Quite important factor I left out. I could have dove deep into this and plotted some nice graph comparisons, but this blog is already long as it is. A suggestion for higher frames is to slowdown the footage or replay (0.5x). If you’re looking to run ingame, I suggest you change the model (as I stated above).
League-X Evaluation
There is no comparison with League-X because the evaluation framework cannot be easily adapted to League-X and I do not want to put more effort into evaluations anymore (I found League-X after I had written the entire post already). It does have some of the issues like the other projects where not all champions are in the dataset and in particular, a very limited training set for champions, so the results should be somewhat similar to the evaluation of DeepLeague.
Source
The source is published here
End
Thanks for reading this post. As always, feel free to reach out to me on twitter or comment below if you have any questions!
Special thanks to Liam Dugan and Justin Shaw for giving advice, reviewing this post and providing fantastic feedback! :)
Enjoy Reading This Article?
Here are some more articles you might like to read next: